Is there precedent for a wetter than average March in Colorado during a La Niña?

Our March/April/May outlook we released a few weeks ago was for a bias toward near average temperatures and below average precipitation for Northeast Colorado, and drier than average conditions across the region on the whole. This is largely based on the continued La Niña, and a host of other teleconnections and considerations which went into our analog package for the coming three months.
While we've been discussing how this La Niña is different than many (most?) others given the configuration of warmth in the northern Pacific, both climate models and all the analogs we use would support this to be true.
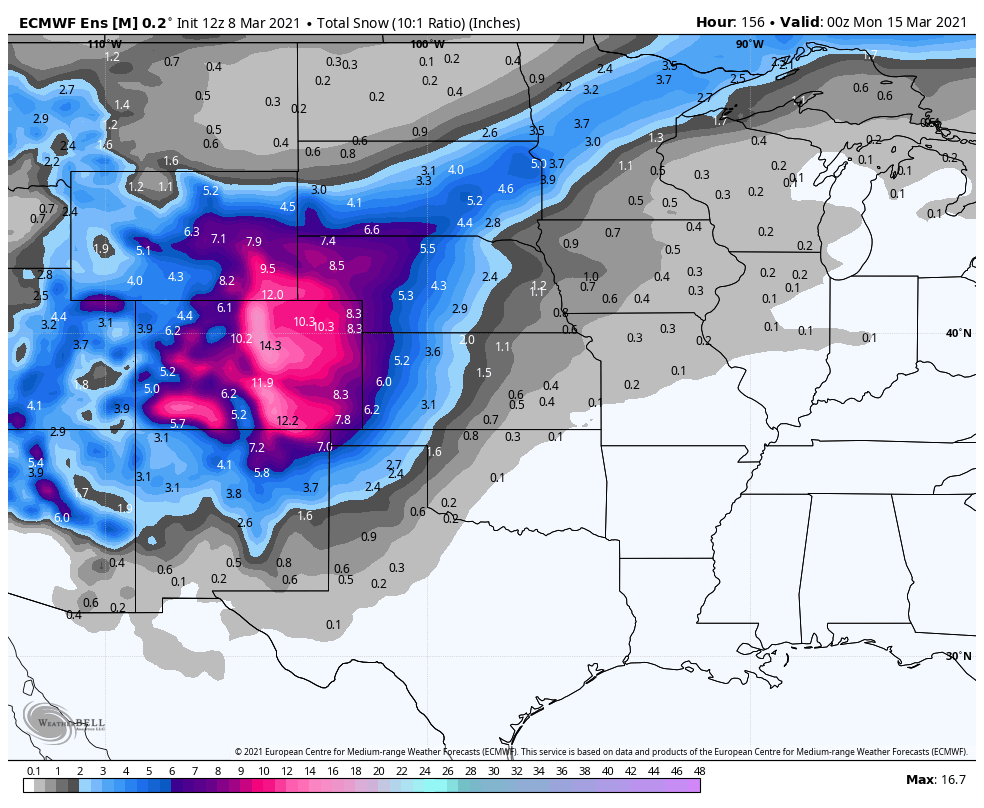
Now, three months is a long time and the next 10 days won't necessarily change that outlook – the drought is very well established in many areas – but precipitation in some of the models for this period would certainly put a dent in our overall thinking. IF we're to end up with a wet March, and IF that helps temper the ongoing drought, we will happily cheer it on nonetheless. There's always more drought to be had around here, and better to fault this way than the other!
With that said, we thought it would be interesting to look at prior March La Niña years and see if there's much support for the type of precipitation anomalies some models are forecasting for the next 10 days or so. The short answer is... there's really not, especially in Niña years since 1950, a good benchmark given the changing climate and available data.
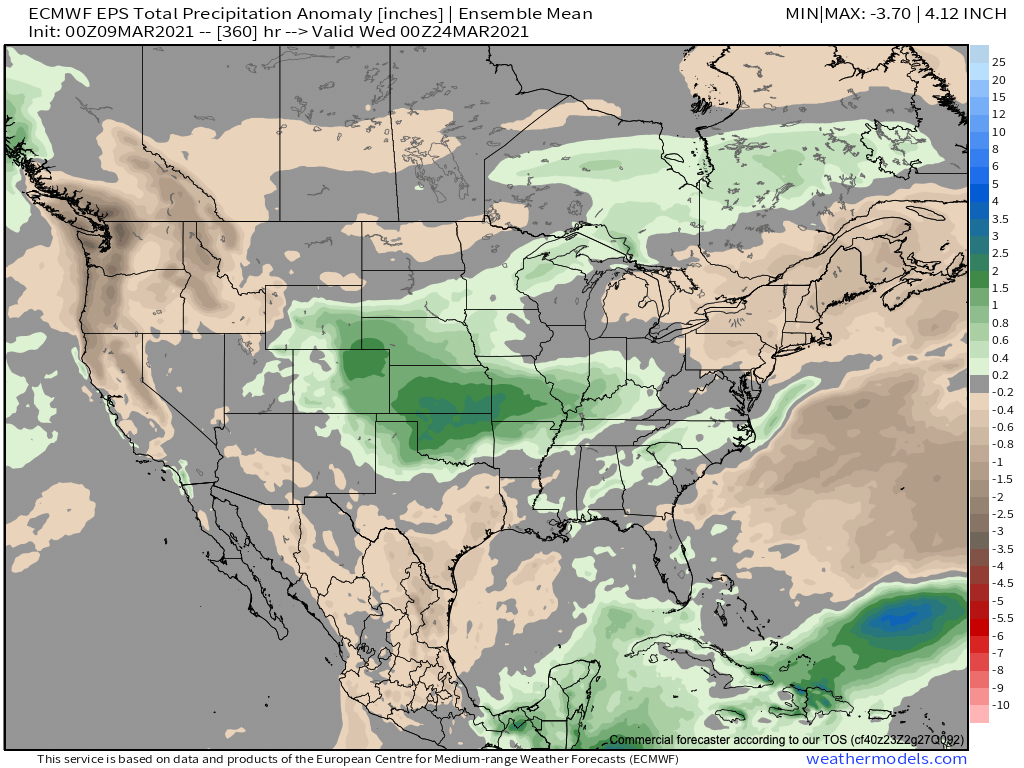
First, here's a look at the precipitation anomalies as forecast by the European ensemble model through March 24rd. It certainly doesn't look dry across Eastern Colorado and the greater region!
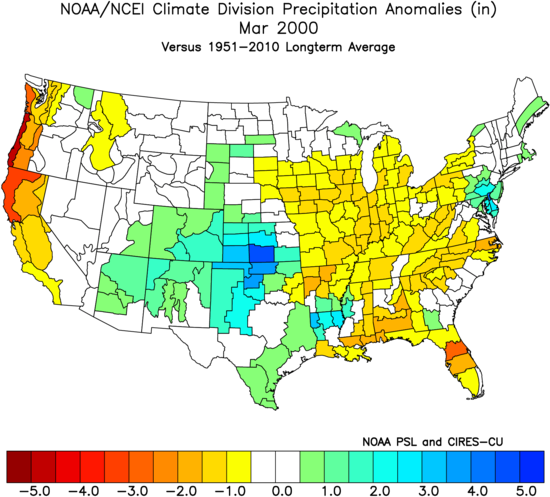
If we look at all La Niña years since 1950 using MEI values, it's hard to find an analog to match this, should it come to fruition. The closest match would be 2000, and it's actually not all that bad a match:
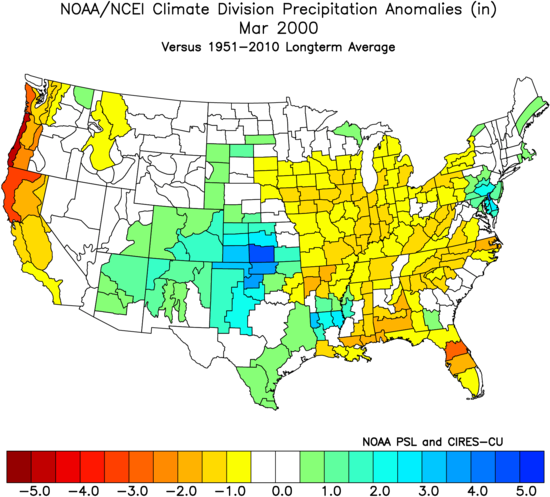
It is, however, an anomaly. Below are a pile of maps of all the other years on the list, not one of which featured above average precipitation for Eastern Colorado! In fact, while many featured near-average precipitation for the month of March, many ended below average as one might expect.
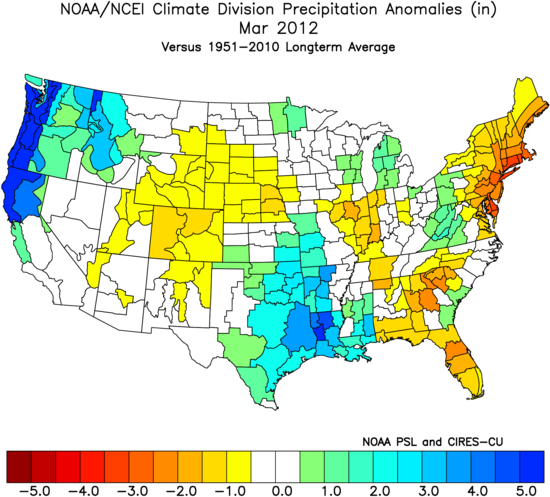
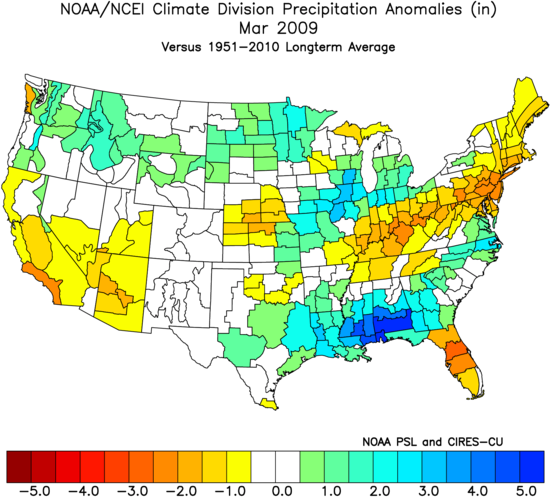
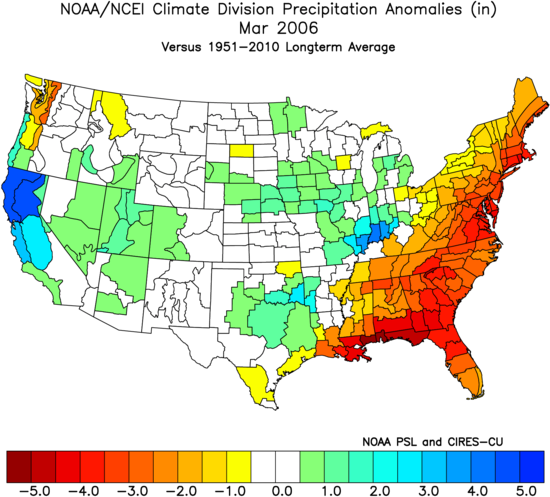
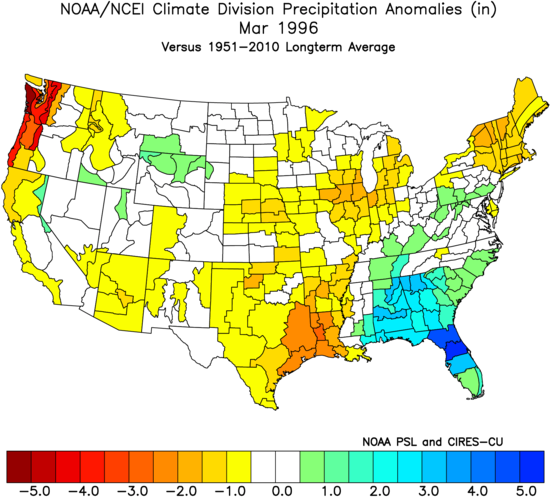
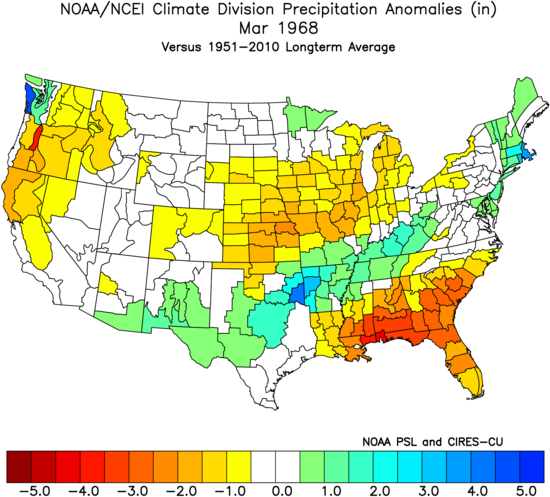
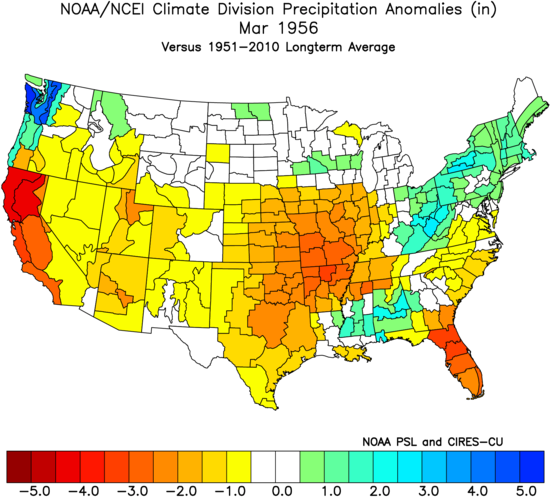
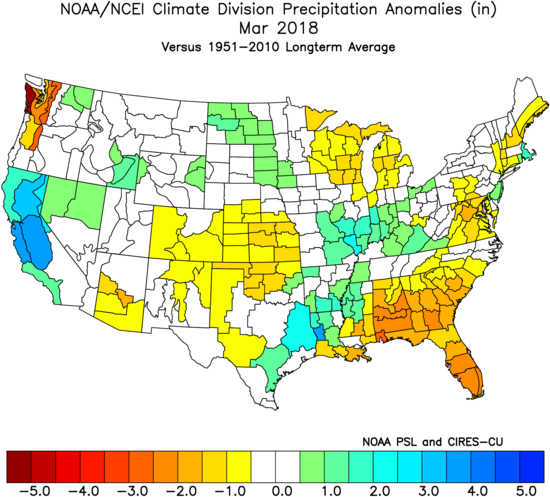
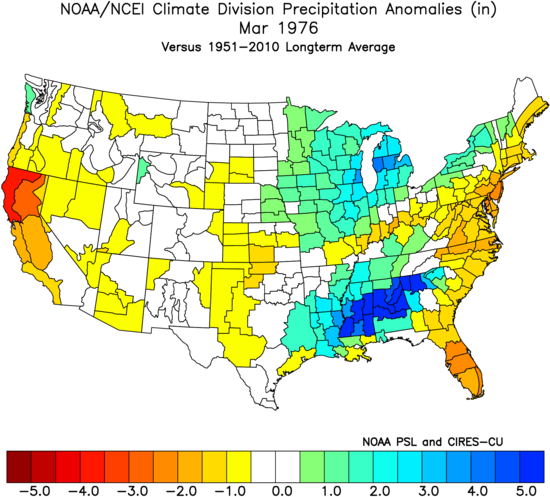
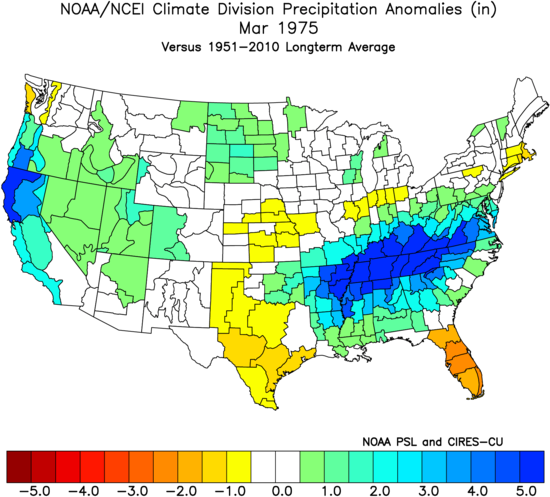
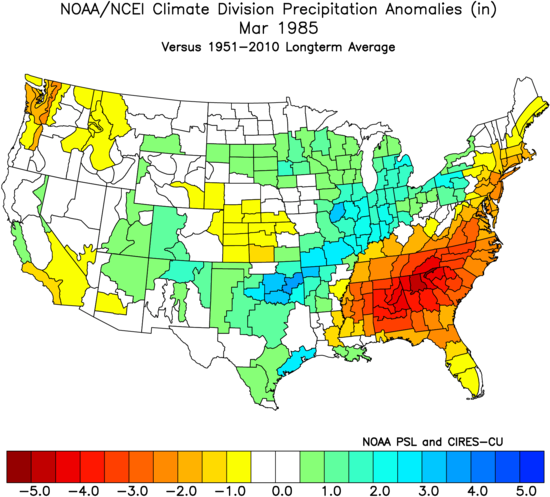
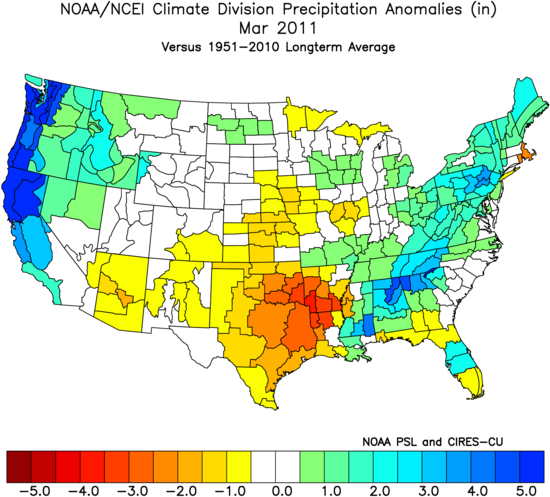
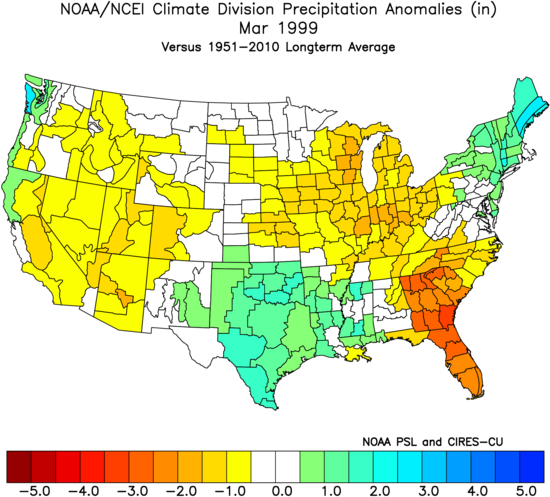
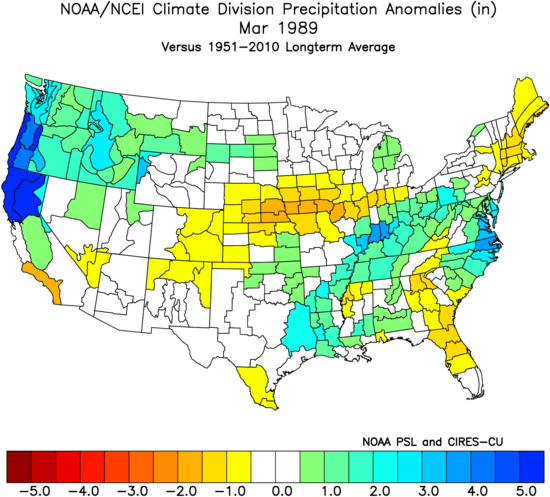
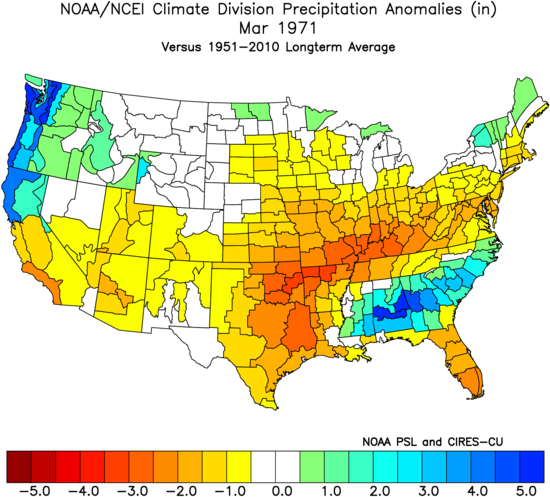
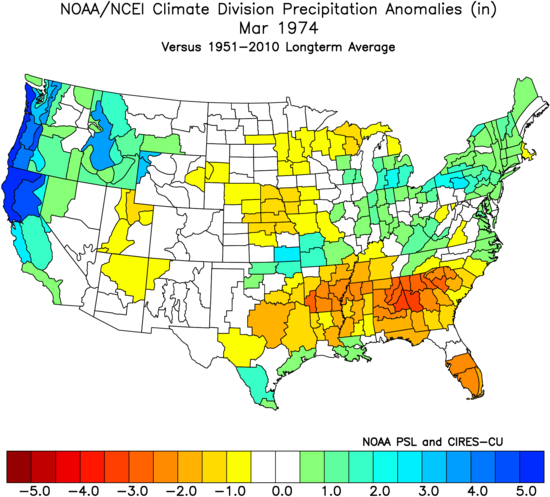
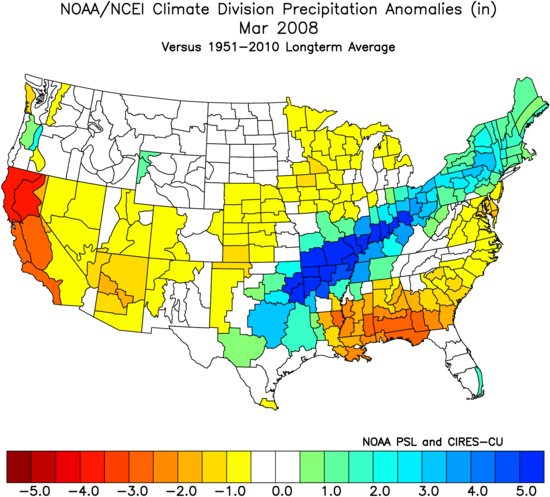
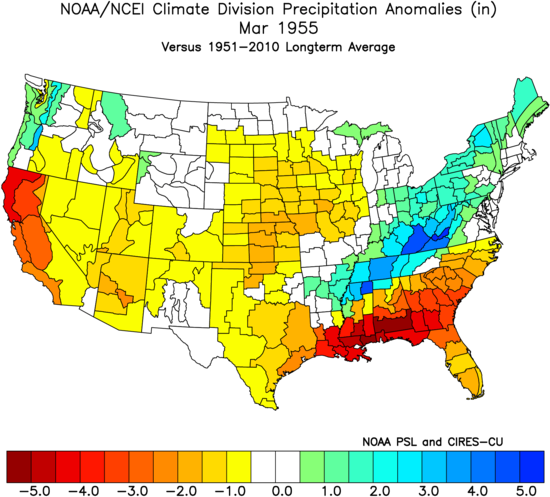
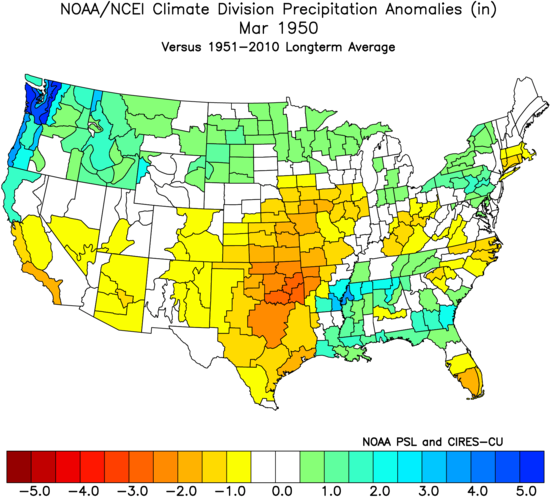
So, is this a 2000 repeat? Is it something altogether new? Are models just totally off base and the month ends up nowhere near as wet as it looks today? Time will tell. Frankly there's not much sense in counting our chickens here before they hatch, so we'll see if this upcoming anomalous weather event pans out or not.
The snowiest Marches for Denver in the years listed are as follows. All the other years recorded less than 10" of snow for the month. On average, Denver picks up 11.3" of snow in March, making it Denver's snowiest month on average. Remarkably, 2000 was the wettest for the climate division on the whole, but not the snowiest in the list for Denver.
- 1955: 19.5"
- 1976: 18.7"
- 1996: 16.4"
- 1975: 14.3"
- 2009: 13.8"
- 1974: 12.8"
- 2000: 11.3"
March 1955 was clearly a very snowy one for Denver, La Niña or no La Niña. Interestingly, it came as a result of numerous storms and not a single March blockbuster. The biggest snow event for the month that year was 9.5" on the 25th.
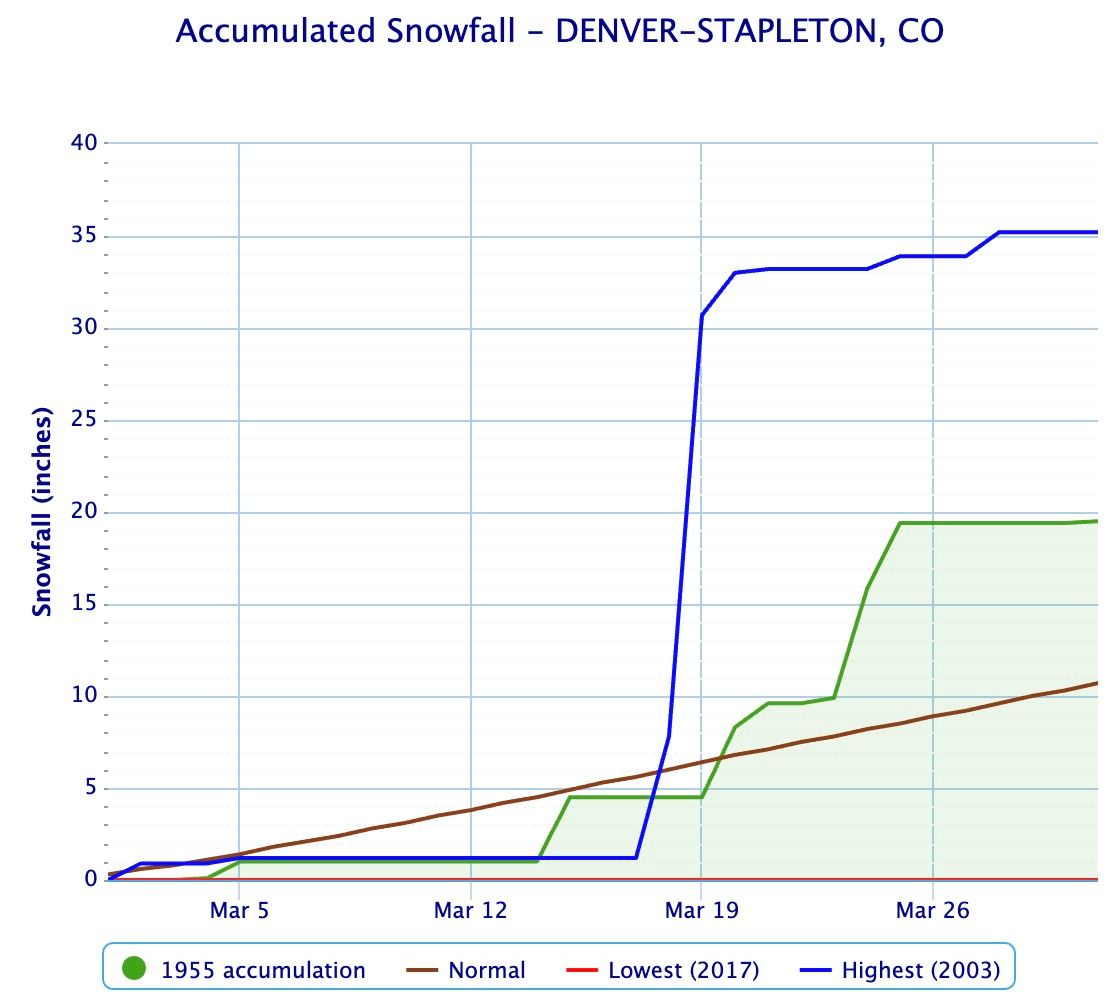
Denver's snowiest March on record was in 2003, not a La Niña year but rather an El Niño. That year the city picked up 35.2" of drought-busting snow, thanks in large part to a single event which delivered 31.8" to the city between the 17th and 19th of the month.
Should current data hold, and should we end up with not only an above average snowfall month but above average precipitation too – this year would certainly stand in contrast to history.
