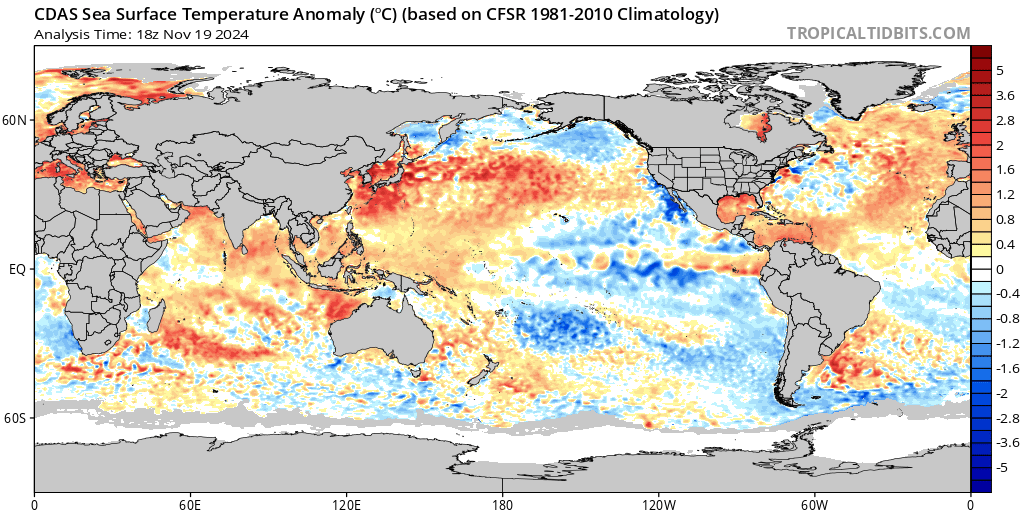
November La Niña update and winter outlook

Historically, if La Niña is going to strengthen, this is the time of year it will happen. So, let’s see what it's up to.
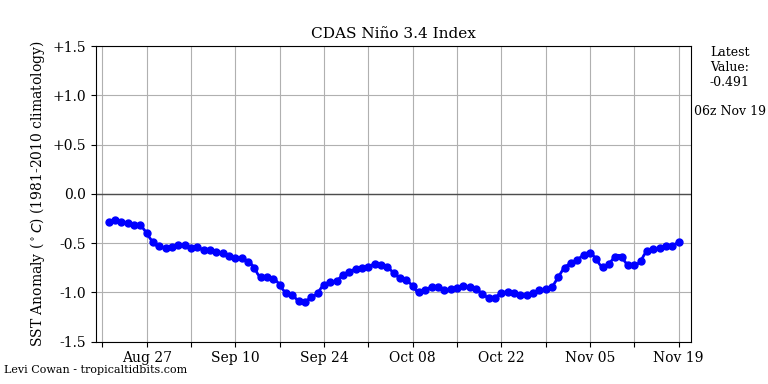
The graphic above shows how La Niña has been behaving since the middle of August. To be classified a La Niña, that dotted blue line needs to be at or below -0.5 for three consecutive months. Technically, we have briefly achieved that threshold, however, you can see that since the end of October, it has been weakening a bit. As of now, we are barely hanging on to weak La Niña status.
Also, we need the atmosphere to respond and couple to the ocean for this La Niña to truly have a meaningful impact. Is that happening? Not yet.
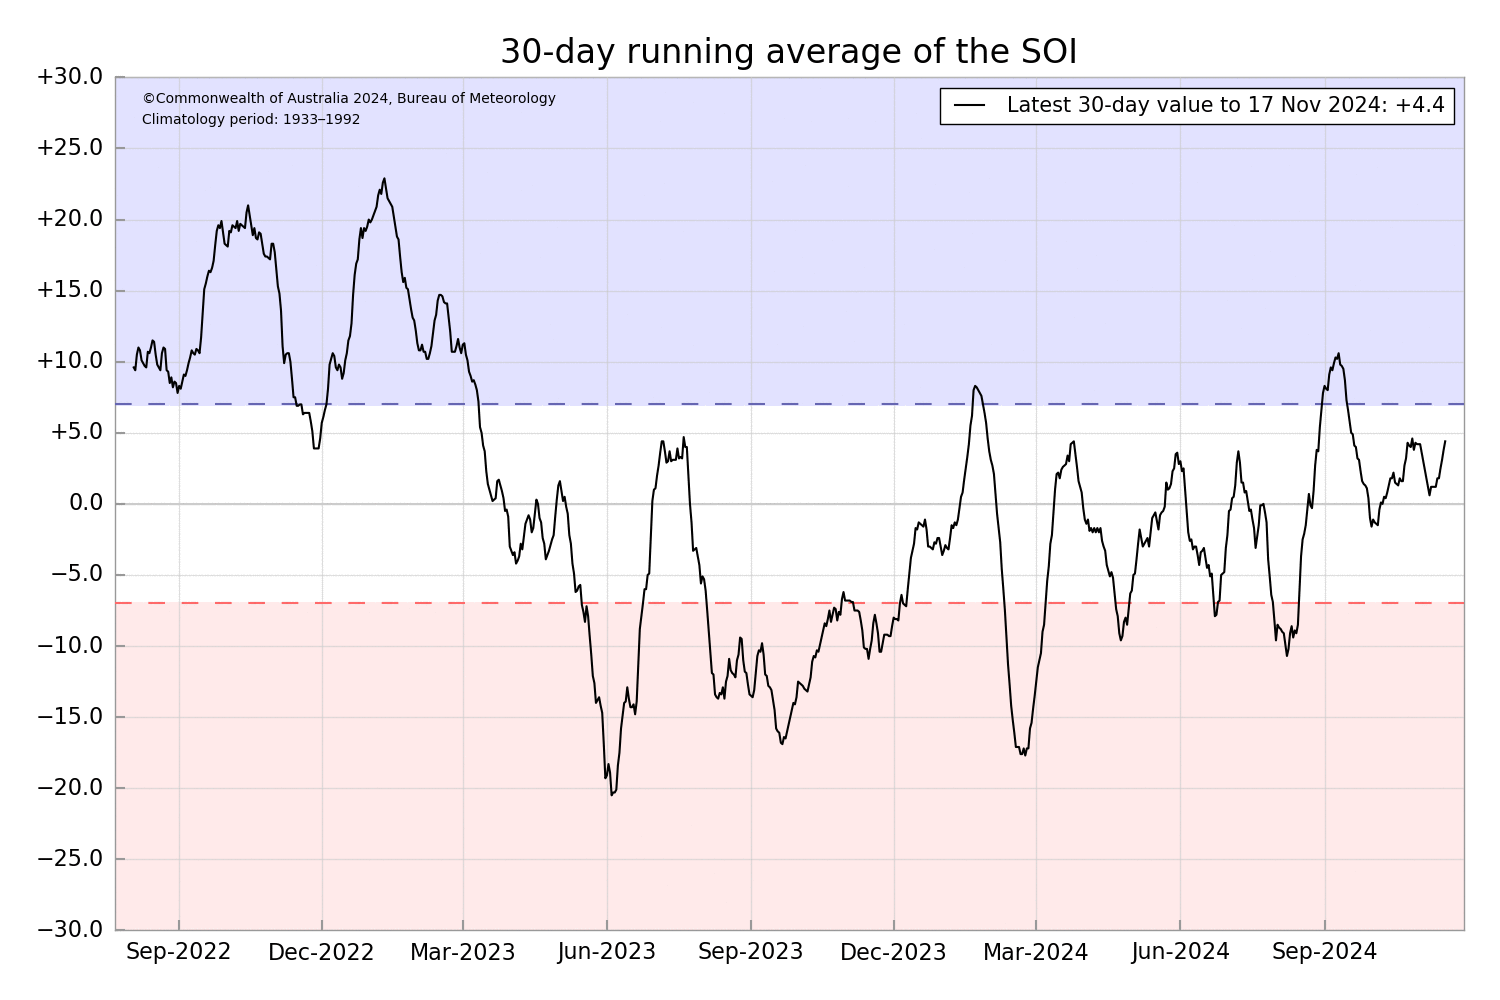
The graphic above is a measure of the Southern Oscillation Index (SOI). When it is around +10 or above, we are in La Niña. You can see back in 2022 how positive it was and we were certainly in a La Niña at that time. Recently, you can see that we briefly went positive in September, but then have been hovering in neutral territory with no major move to positive territory. The big question is, will that continue?
The graphic below is a equatorial trade wind forecast for the next couple of weeks. As I write this, there looks to be a solid surge in the easterly trade winds along the equator. This shows up as green and blue on the graphic below:
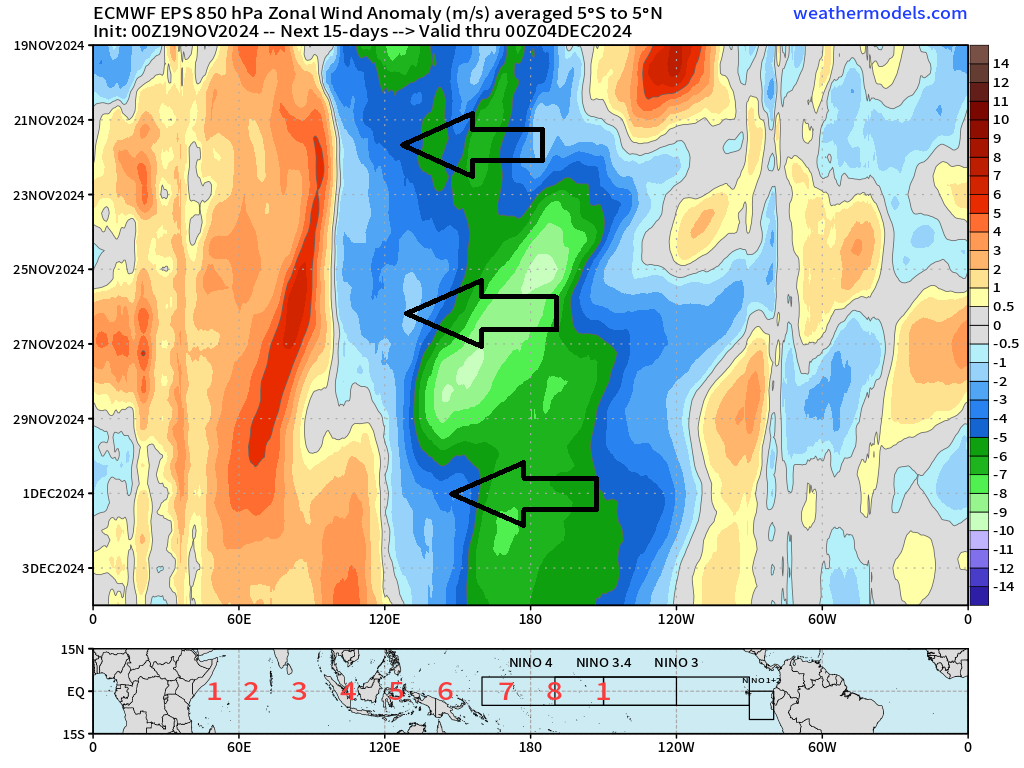
In order for La Niña to start developing again, those easterly trade winds not only have to be strong, but also have to persist. For right now, it looks like that will occur. So, I would expect us to see this weak La Niña intensify a bit. Do I expect this La Niña to become a moderate or strong event? No, I do not.
On another note, westerly wind bursts show up as orange and red, and will likely remain confined to the Indian Ocean and far western Pacific. This configuration also keeps the MJO focused across the Indian Ocean and far western Pacific. That's usually not a good spot for the MJO to favor, if you like big storms east of the mountains. We'll see.
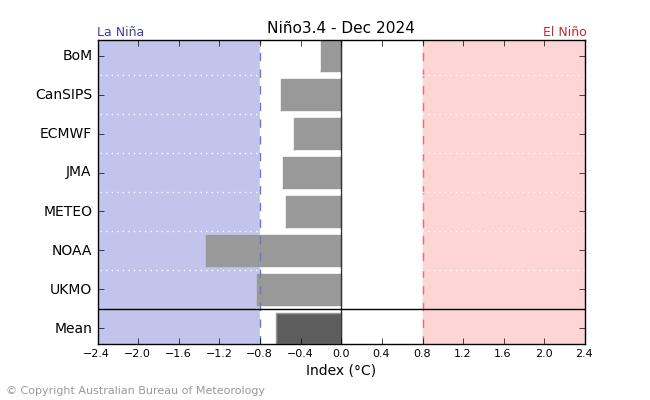
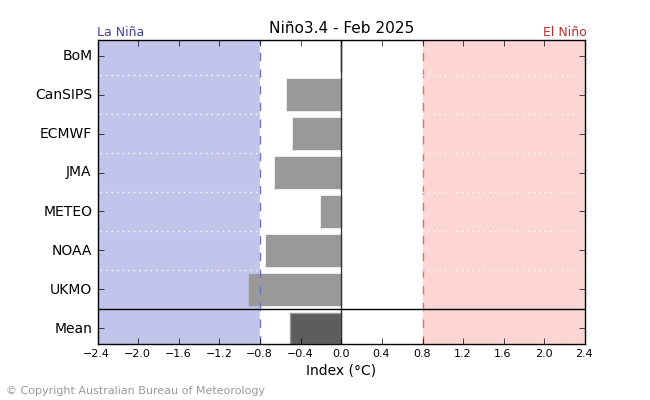
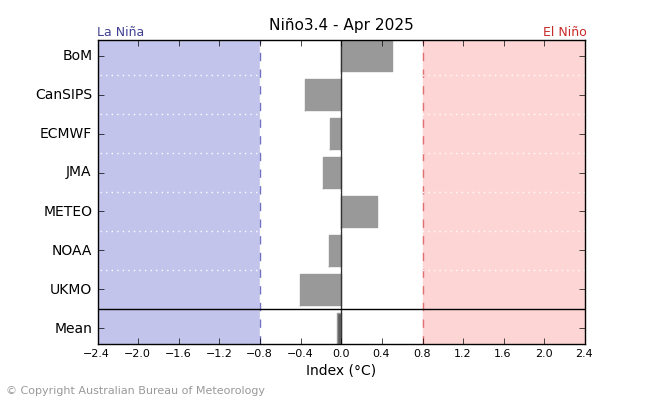
The graphics below show the various models and how strong and long they think this La Niña event will become.
December ENSO Forecast
February ENSO Forecast
April ENSO Forecast
A couple of takeaways…
- NOAA is consistently the strongest with this event and lingers it the longest. NOAA has also been the most inaccurate for the past few months.
- The BOM and ECMWF models, which are my favorites, are not as strong or long lasting with this event, and have been much more accurate with their forecasts. In fact, they really don’t show much of a La Niña event at all.
- The BOM and METEO models actually warm the ENSO region to +0.4 during the spring. This would indicate a subtle move toward a possible weak El Niño. I am not discounting that possibility, but the confidence in that happening is pretty low at this time.
What does this mean for the next few months? The model forecasts for December/January/February are shown below.
EURO Seasonal Model Precipitation Anomaly Forecast Dec/Jan/Feb

EURO Seasonal Model Temperature Anomaly Forecast Dec/Jan/Feb

NMME Model Precipitation Anomaly Forecast Dec/Jan/Feb

NMME Model Temperature Anomaly Forecast Dec/Jan/Feb

IRI Multi-Model Precipitation Anomaly Forecast Dec/Jan/Feb

IRI Multi-Model Precipitation Anomaly Forecast Dec/Jan/Feb

The model consensus would show a average to drier than average conditions for Colorado. The more robust dry signal does show up across the southern tier of the state. We usually don't give a lot of credence to the temperature forecast from the seasonal models, as they are notoriously bad on picking up any cold temperature signal. However, it is interesting to note that the IRI bucks the trend of the EURO and NMME, and shows a colder than average winter for most of Colorado and the adjacent Plains.
What does history show? Since 2000, we have had 11 La Niña events. Of those, six have been classified as weak. The precipitation anomalies that occurred for those winters are shown below.


As you can see, there is some variability. That is usually the case when we don't have a strong La Niña signal. However, it is interesting to note that the northern part of the state didn't show up drier than average in any of those winters! While there is not definitive tip toward wetter or drier than average for the southern part of the state, two of those winters showed up drier than average. Areas east of the mountains and south of the Palmer Divide have the greatest chance of being drier than average. That is somewhat reflected in the models too... That being said, there is no strong evidence suggesting a dry winter is in the cards for the northern tier of the state.
A big question many are asking... "Was the recent big snowstorm a harbinger of an active winter?" In one word, no. There is really no correlation one way or the other. However, it is important to note that this La Niña will be weak and short lived. That should make for much more weather variability versus if we were locked into a stronger La Niña event. Plus, this "event" should be gone by spring. While that is not a guarantee for a wet spring or a dry spring, it is better than being locked into a La Niña weather regime. In our next update, I will dig into that further.
