Seasonal Forecast Update

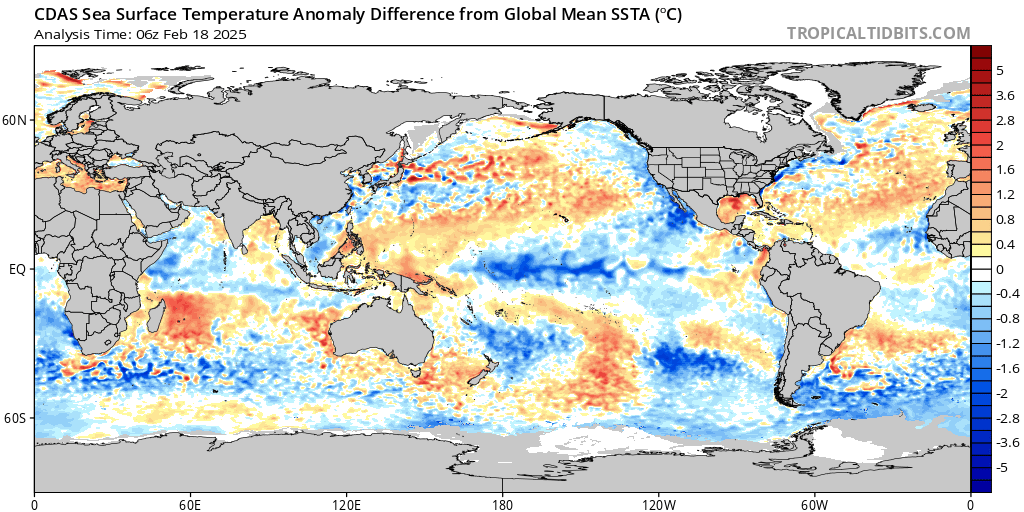
Current La Niña Status The map below shows the current sea surface temperature anomalies as relative to the global mean sea surface temperature anomaly. It is a metric that better represents the current strength of the particular ENSO (El Niño/La Niña) phase. The blue shading along the equator clearly shows the presence of a La Niña. The graphic below shows the sea surface temperature anomaly trend since November. Since mid-November, you can see that this La Niña event maxed out around Chris
This is a Insider post. Please login, or sign up for Weather5280 Insider to continue reading.