A Closer look at What El Niño Means for Rain and Snow in Colorado

There has been a great deal of interest in El Niño recently, following multiple authoritative statements that it is on track to be "a significant event". This conjures up memories of 1997, which was a significant year for El Niño.
This was the year Chris Farley performed his famous El Niño spoof on Saturday Night Live, and by doing so, Farley made El Niño a larger topic in pop-culture. However funny, El Niño is part of a complex global weather pattern and cannot be singled out as the cause for a specific type of weather feature.
For Colorado and the U.S., we have many dominant weather patterns tied to other events similar to the El Niño Southern Oscillation (ENSO). You’ve heard us mention these before at Weather5280: PDO, AMO, MJO, etc.
Those other factors are also drivers of our seasonal weather changes. Yet, since El Niño is grabbing the headlines. Today we'll focus on El Niño, knowing that ENSO alone isn't the only "player".
What is ENSO?
The Pacific Ocean near South America stretching westward to Australia is a highly variable area of the ocean. The ocean temperatures here fluctuate on monthly and yearly scales based on ocean circulations. Those ocean currents can lead to one area of the ocean being hotter than an adjacent area.
The ocean temperatures will then cause the atmosphere above to behave differently, thus creating a weather pattern. El Niño is the period of time when this Pacific water is warmer than average. La Niña is when this same water is colder than average.
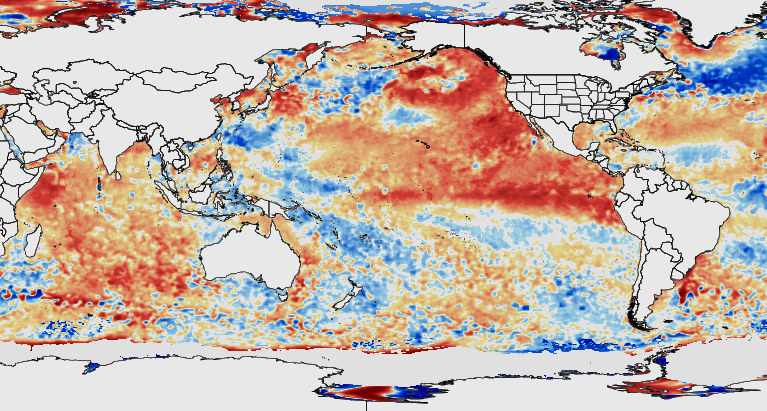
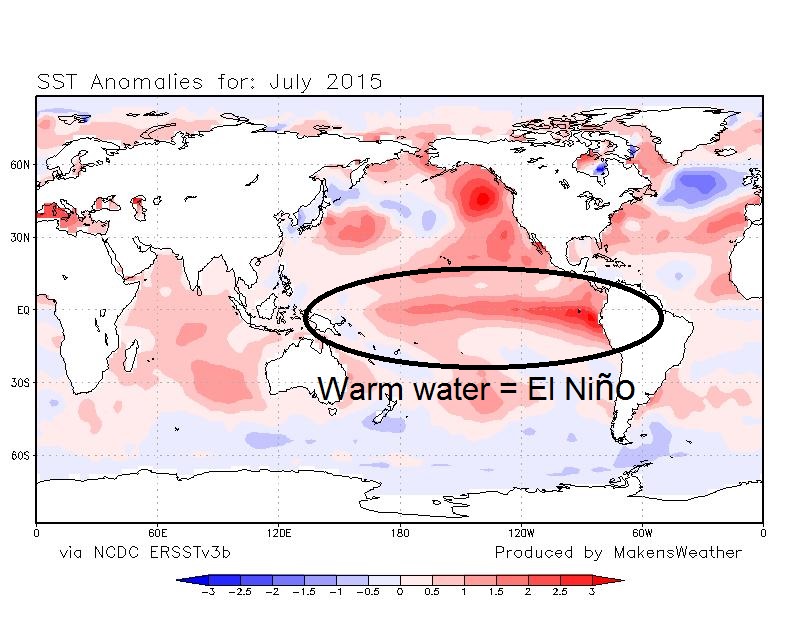
Here's the sea surface temperature anomaly for July. It clearly shows a warm southern Pacific region.
Within the ENSO there are multiple varieties of “El Niños”; there’s Niño 4, 3.4, 3, 1+2, Modoki, etc. These different varieties are based on location within the southern Pacific Ocean that observations are made. For a quick example, Niño 4 is closer to Australia and Niño 1+2 is nearer South America. Let’s not get too weighed down in the variety for the purpose of this article as all indicate El Niño.
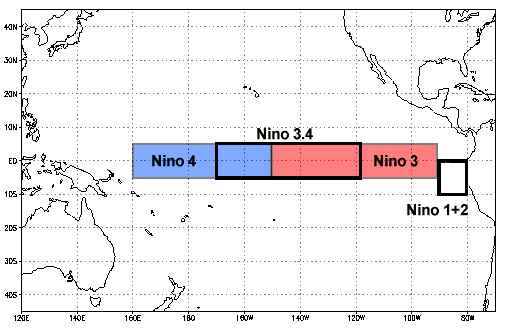
Scientists calculate index values over these dominate ocean areas that account for water temperatures, air pressure, and wind patterns, etc.
Since El Niño (warmer Pacific Ocean temperatures) will affect the weather patterns above, it is important to gauge the level of its influence, hence the index values compiling all those important elements together.
Perhaps the best all-encompassing index is called the Multivariate ENSO Index (MEI). This is the index that I will be referring to throughout this blog.

We currently have a strong MEI signal (3rd strongest recorded) that will likely persist through the end of 2015 and into the first half of 2016 based on current climate modeling. You may ask, "how does the weather pattern over the southern Pacific affect us?" It’s part of a giant system, so what happens in one part of the globe will have to be compensated somewhere else.
How has El Niño impacted us before
To see how an El Niño forecast might impact Colorado, I studied past ENSO events and their associated precipitation anomalies around the state.
In order to do this I’m only considering 1950 to present with the more accurate MEI measurements. Prior to 1950 we had a couple of world wars, some questionable data logging, etc. that skewed the record a bit. So we aren’t dealing with nearly the length of record I would like, however, it is an accurate representation of the past few decades and is fitting for the purpose of this article.
Knowing the ENSO condition of every month since 1950, I can average out what the phase (El Niño, neutral, or La Niña) was for every season; again, using the MEI.
Colorado's precipitation data goes as far back as the 1800s, which is a good lengthy record. Using the average precipitation, per season, over that time as a guide, let's see how the ENSO phases can bring more/less/equal moisture.
When we have been in an El Niño phase, the state as a whole has had more than average precipitation amounts in summer (June through August), fall (September through November), and spring (March through May). Winter (December through February) was right near the average. That’s nice to know for a general starting point.
However, you know how big and diverse the geography is for the state, so it is important to break the state down into a few smaller areas. To do this, I’ll use The National Climate Data Center’s breakdown that you see here (Denver and the greater metro area is within division 4 in Colorado):
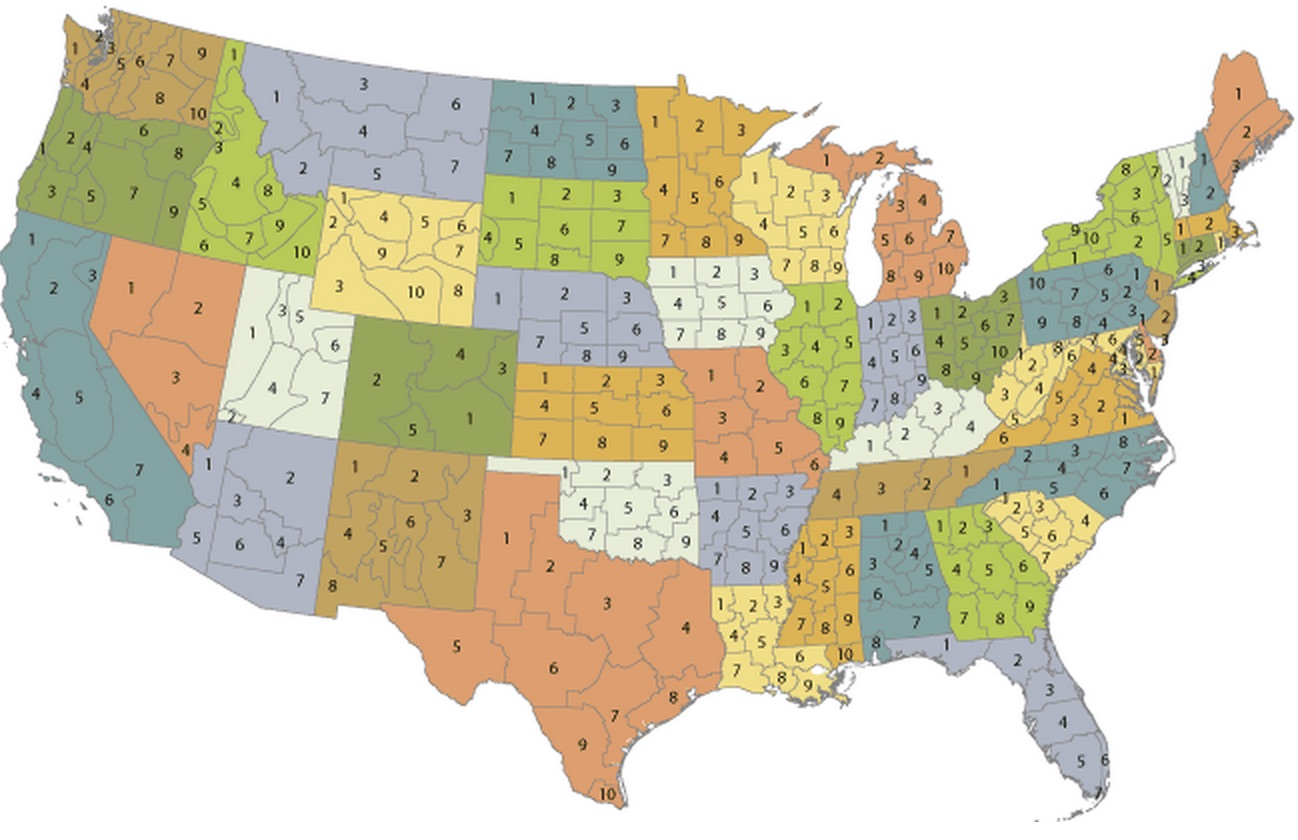
Now, we can see who benefits the most from El Niño per division. In El Niño summers, division 3 (northeastern plains) has benefited the most with nearly three-quarters of an inch more than during the average summer. Division 2, western Colorado, benefited most in the falls. Division 3, again, has had the best moisture during the winter. Finally, division 4, the Front Range, has benefited the most in the spring.
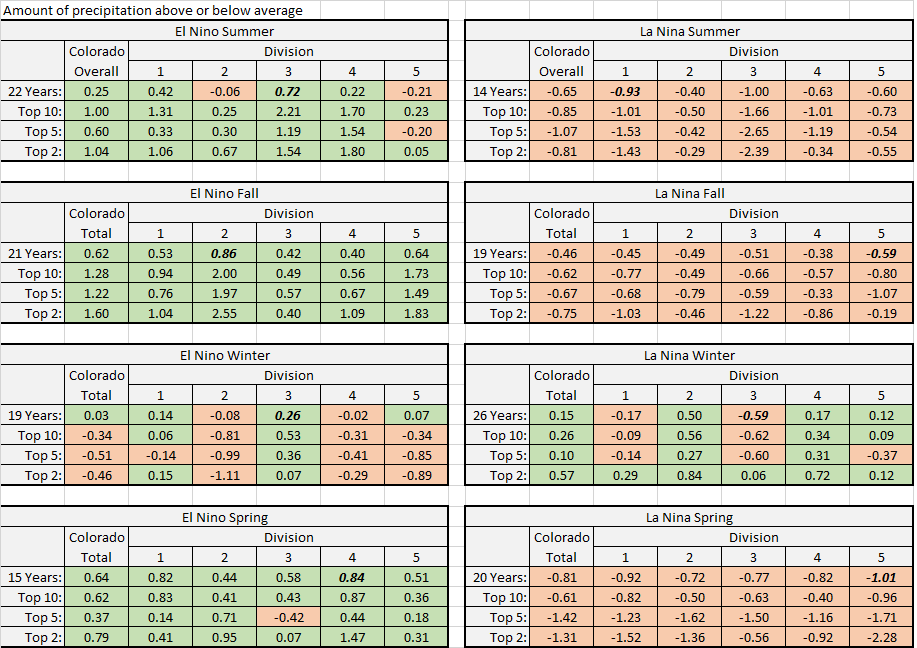
That’s just looking at any El Niño season. However, we know that El Niño has a range of strengths. So, I added the top 10, 5, and 2 ENSO events for each season also.
I’ve created the following tables to show you how many years had above average precipitation based on season and ENSO phase.
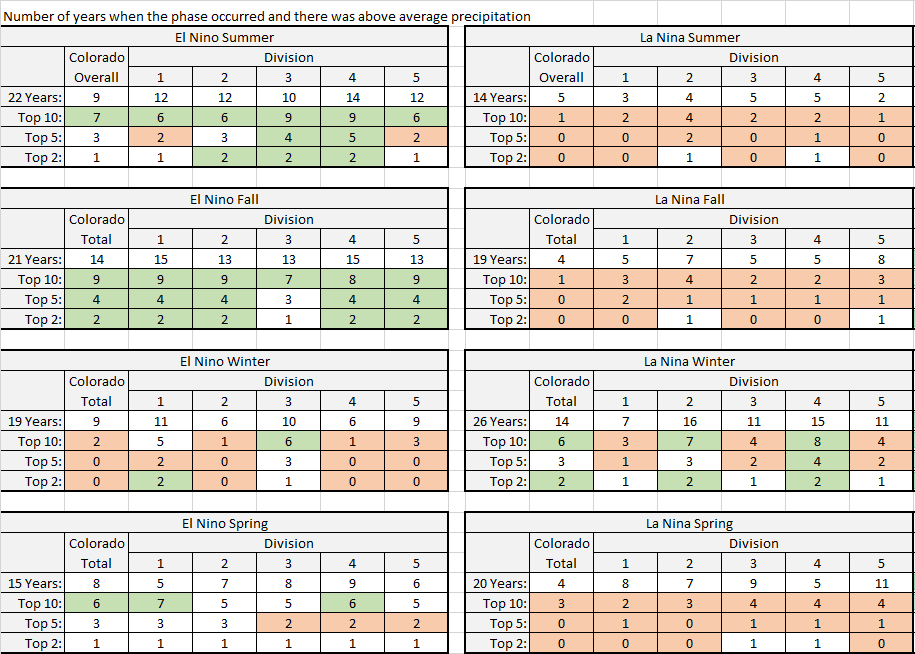
Now you can see where and when a strong El Niño has impact. Fall grabs my attention. The stronger the El Niño the higher number of years have had above average precipitation. With the exception of division 3, notice that a majority of falls in strong El Niños will be wet.
What has El Niño done for our division?
The biggest impact has been wetter summers and falls. Let’s refer to those tables again, only this time let’s talk percentage of years where above average precipitation occurred. That’s shown here:
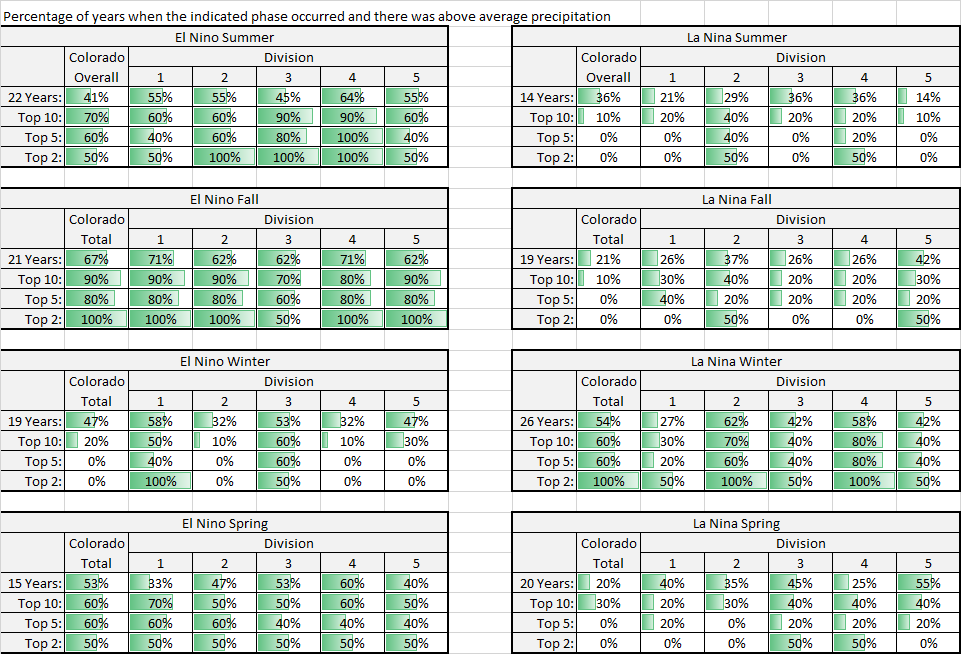
Specifically for Division 4, the metro areas included, we have had 64% of our summers wetter than average when there's El Niño. Nearly all of the top 10 years (only 1 was not) were wetter in the stronger El Niño events.
Fall has been wetter in 71% of the El Niño years, and we get more moisture with the stronger El Niños.
There’s no apparent connection between strength of El Niño and a wet winter or spring. In fact, the Division 4 El Niño winters are drier than average. Again, that's December, January, and February.
Does the strength of El Niño change the impact?
You’d think that with a stronger El Niño we would have more moisture across the board for all areas. That's not quite the case.
Stronger El Niño years don't have an amazingly higher impact overall. To a few areas, division 2 and 4, a stronger El Niño means even more moisture in the summer and fall. Winter and spring certainly don't see much of a wet bias for any division. It really brings the biggest impact to our fall season.
The reason for the apparent lack of winter and spring connection is that we may have a favorable storm track with moderate to weak El Niños, but a storm track that’s too far south in stronger events. The strength of El Niño does impact the storm track and therefore changing where the best rain/snow will fall. The eastern plains and southern Colorado (division 1 and 3) benefit more when there's a very strong El Niño. Little connection for the other divisions, however.
Kyle Mozley with the NWS in Pueblo has done extensive research on this. He finds that an El Niño range of 1.2 to 1.5C in the Niño 3.4 region is the best possible for precipitation in the state. Any stronger than that, which we are now, will keep the storm track too far south. Any weaker than that and the storm track will be too northerly and upslope will be minimized.
Few areas will favor with strong El Niños
Upslope seems to dictate the favored areas during El Niño years. Those tables above don't show great tendencies toward snowy winters, and those divisions used are mixed terrain with varying slopes over relatively large areas.
Knowing that El Niño years bring better upslope storms, let's take a look at those that favor the most snowfall in that type event: Denver and Boulder. Here is where we can start to see a better "sweet spot" for snow totals, in the stronger events.
Here we have Denver’s snowfall data back to 1882. El Niño snowfall seasons are just a bit snowier than average (2-inches snowier) and La Niña’s have a bit less snow (4-inches below average). The difference is likely much less than you were thinking. We are talking the difference of a single snow, or a couple smaller snow storms... not all that impressive. This encompasses all strengths of El Niño and La Niña.
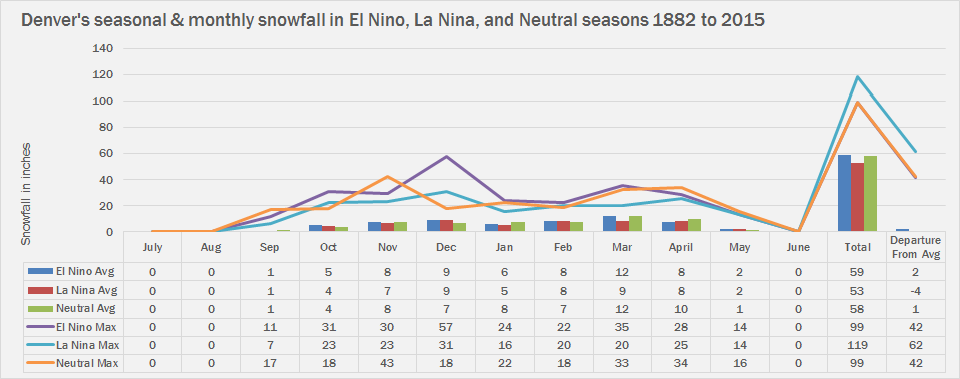
With the seasons looking pretty similar at the surface, Let's look at the strongest El Niño events.
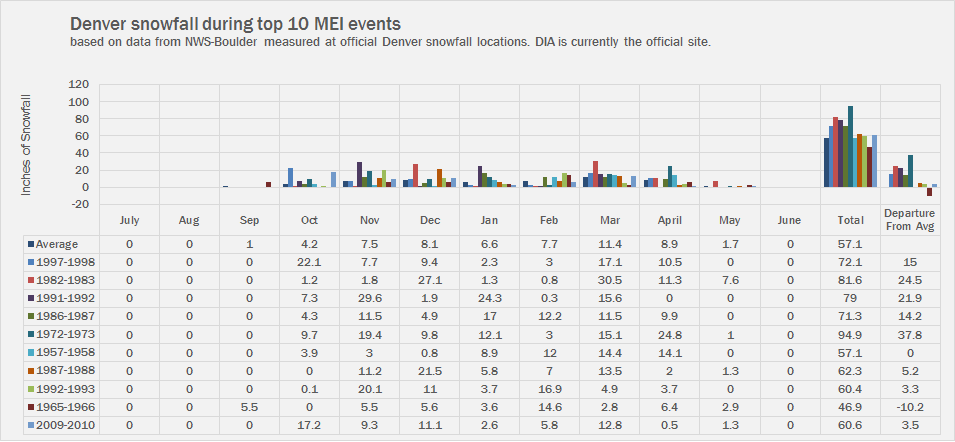
Here's the top 10 event comparison. There is a clearer bias toward heavier snowfall seasons, likely due to stronger singular upslope storm events. Also, note that fall (Sep, Oct, & Nov) has big snows, then we see a relative drying trend in the winter months. Spring (Mar, Apr,May) offer chances for bigger snowfall again. That is a pattern we recognized for the entire division, too.
Dig in a bit more and look at individual snow storms. Here is the list of top snowfalls in Denver history. Eleven occurred in neutral years (N), 9 storms hit in an El Niño pattern (E), and 4 in La Niña years(L).
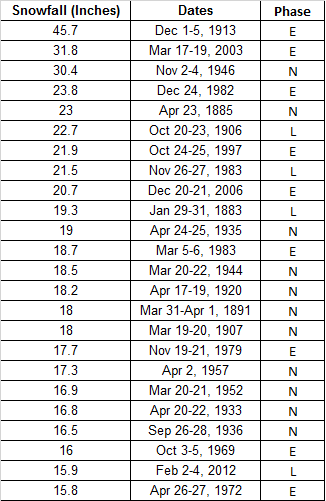
Out of Denver's 24 biggest single snow storms, 11 were in neutral years, 9 in El Niño years, and 4 in La Niña years. With El Niño we are more than two times as likely to have a bigger snow event.
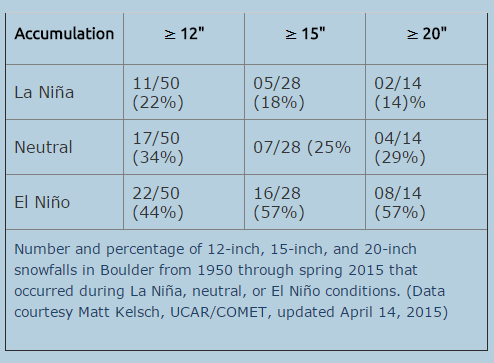
Here’s an example of work done for Boulder showing the connection to larger snowfall events and El Niño phases. In this case there is an even stronger correlation. This makes sense considering El Niño seasons will provide more upslope type storm events that favor the greater metro area.
Remembering 1997
At this point we're not saying your memories of a bad winter in 1997 are invalid. There was a singular big snowstorm that pushed the season to 72 inches, 15 inches snowier than normal. However, that was due to one storm in October. Overall 1997-98 wasn’t known for its winter, it was known for a very active monsoon in the summer and fall.
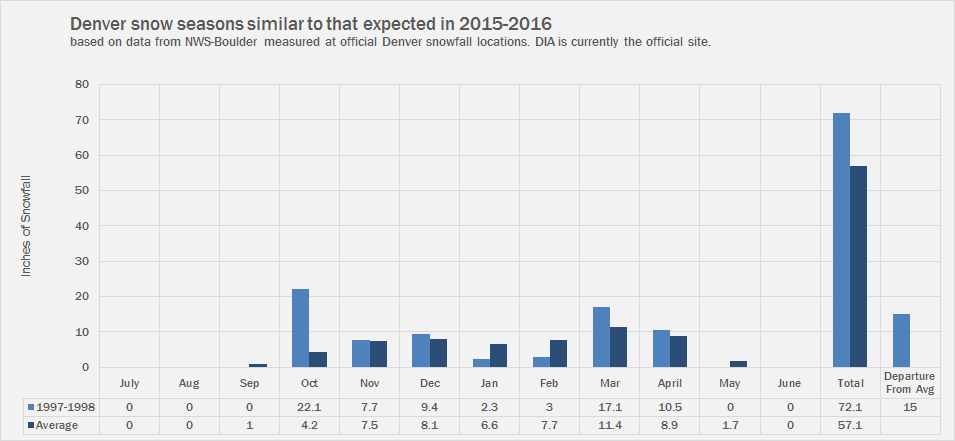
The summer of 1997 was incredibly wet. The Front Range was 3.33 inches wetter than average. The fall was nearly 1.5 inches wetter than average, but then it stopped. The winter of 1997/98 was a quarter of an inch drier than normal and the following spring was nearly an inch drier than average. That’s using 1997 as an example.
The strong El Niño of 1997 didn’t bring the mountains much snow either. In fact, much of that winter into 1998 had only 50-90% of average mountain snowpack.
Based on history, what are we likely to see in the rest of 2015 given El Niño?
Knowing we are in one of the strongest El Niño events in history, we know that our summer and fall are likely to be wetter than average. That goes for the entire state.
The eastern plains will benefit most this summer, and the western third of the state will likely benefit the most this fall. Yes, the metro areas will likely see average precipitation through fall, as this fits the division 4 history.
Should El Niño be as strong in the fall as it is now, we do have an increased chance for a bigger singular snowfall event(s), providing other mitigating factors do not overcome the event.
The strength of El Niño by winter will help dictate if we can sustain higher than average moisture (snow) in the spring.
TL;DR
El Niño is a fantastic water-cooler topic. Yet, it is a very poor indicator, on the broad view, as to what a winter can bring Colorado due to our variety of terrain, and importantly other large-scale actors such as the PDO, AMO, MJO, etc. Those atmospheric patterns really shouldn't be discounted as they can "make or break" a strong El Niño, and have impacted each of the years discussed here.
On average El Niño can bring a bigger snowstorm making a season above the average 57” for the city. We can, however, have big snows in a neutral years though too though. On average, El Niño years run 2" above normal snowfall for Denver, while La Niñas run 4" below normal.
From a forecasting perspective, El Niño can be more reliably used to forecast a wet fall with greater certainty, and some certainty toward a wetter summer. For the winter months El Niño doesn't typically equate to more snow, except for a few upslope prone locations.
We continue to work on all-inclusive analog years, and will continue discussing them over the weeks and months to come. Stay tuned!
